
Parent Effort Scale (PES) |
© 2017 Beth Pfeiffer
|
Description: The Parent Effort Scale (PES) is a questionnaire developed by a team of researchers to measure the amount of perceived effort (work) parents have to expend in order to help their child participate in everyday activities. The tool was initially developed for children with Autism Spectrum Disorders (ASD), but went through additional research for children without ASD. It was initially developed to report on parental effort to support participation in daily activities in children ages 3 to 7 years old, but is suggested for use in children up to 10 years of age.
RESEARCH, PUBLICATIONS AND PRESENTATIONS:
Publications
Bevans Katherine B., Hallock Taye M., Piller Aimee, Pfeiffer Beth (2022). Psychometric Evaluation of the Parent Effort Scale. Frontiers in Rehabilitation Sciences. Vol. 3. https://doi.org/10.3389/fresc.2022.780302
Schiavone, N., Szczepanik, D., Koutras, J., & Pfeiffer, B. (2018). Caregiver strategies to enhance participation in children with Autism Spectrum Disorder. OTJR: Occupation, Participation and Health: http://journals.sagepub.com/doi/full/10.1177/1539449218786713
Schiavone, N., Szczepanik, D., Koutras, J., & Pfeiffer, B. (2018). Caregiver strategies to enhance participation in children with Autism Spectrum Disorder. OTJR: Occupation, Participation and Health: http://journals.sagepub.com/doi/full/10.1177/1539449218786713
Presentations
Pfeiffer, B. Reliability and Factor Structure of the Parent Effort Scale Home Version (PES-H), Poster. Co-Presenters: Piller, A. & Bevans, K. American Occupational Therapy Association Annual Conference. April 6, 2019.
Pfeiffer, B. Parental Strategies to Support Home and Community Participation for Children with Autism Spectrum Disorders, Poster. Co-presenters: Schiavone, N, Szczepanik, D. & Koutras, J. American Occupational Therapy Association Annual Conference. April 20, 2018.
Pfeiffer, B. Exploratory Factor Analysis and Test Re-Test Reliability of the Parent Effort Scale. Co-presenter: Piller, A. Occupational Therapy Summit of Scholars. June 2, 2017.
Pfeiffer, B. Exploratory Factor Analysis and Test-Retest Reliability of the Sensory Environment and Participation Questionnaire. Co-presenters: Bevan, K. & Coster, W. American Occupational Therapy Annual Conference. March 31, 2017.
Pfeiffer, B. Caregiver’s Perspectives on the Sensory Environment and Participation in Daily Activities for Children with Autism Spectrum Disorders, Poster. International Meeting for Autism Research. May 14, 2016.
Pfeiffer, B. Measure of Participation and the Sensory Environment for Young Children with Autism Spectrum Disorders. Co-presenter: Coster, W. American Occupational Therapy Association Annual Conference. April 17, 2015.
Pfeiffer, B. Development of a Measure of the Sensory Environmental Impact on Participation in Children with Autism Spectrum Disorders, Poster. American Occupational Therapy Association Annual Conference. April 4, 2014.
Pfeiffer, B. Development of a Measure on the Environmental Impact on Participation in Daily Activity for Children with Autism Spectrum Disorders. Health and Disability Research Institute. May 15, 2013.
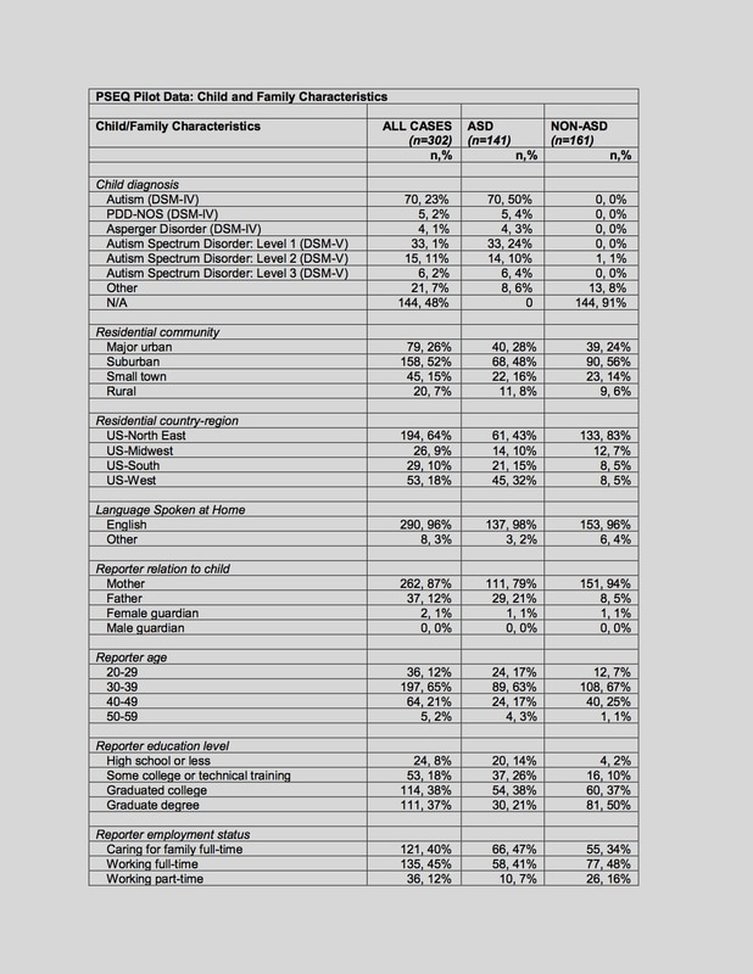
Additional Research: Preliminary Psychometrics
Three hundred and two parents of children between the ages of 3 and 7 with (N = 141) and without (N = 161) Autism Spectrum Disorders completed all of the scales of the PSEQ, along with the Gilliam Autism Rating Scale – 3rd edition, and demographic questions to establish reliability and validity of the tool. Participants were from 35 different states. Among these families, 302 had completed the initial cross-sectional online survey, while 129 completed the online follow-up survey to determine test-retest reliability. In the sample, 141 families had a child with a diagnosis of ASD-spectrum disorder based on scores of the GARS, while the other 161 participant’s children did not meet the criteria for ASD. Among the respondents, 87% were the targeted children’s mothers; 65% were between 30-39 years old; 73% had at least college degrees; 40% provided care to children full time while another 45% worked full time; 83% were white; and 40% had family income greater than 100,000 annually. Among the targeted children, 35% were females and on average 5 years old.
The Home Sensory Scale (HSS) is a 15-item scale that shares the identical stems with the Home Effort Scale. However, the home sensory scale asks caregivers to evaluate the impact of their children’s sensory functions on their participations in the 15 listed home activities. The response options range from 1 (none) to 5 (too much to participate). All the items in HSS have reasonable distributions. However, the item distributions are very different between families with and without children with ASD. While families with ASD children often have even distributions across response categories, families without ASD children mostly cluster around the lowest response category throughout the items. On the HSS, there is one dominating factor on which all the 15 items can load. However, 4 additional small yet significant factors may be needed to explain additional correlations among items that address similar life domains. The HSS has very high reliability with Cronbach’s alpha = 0.96 (95% CI: 0.96-0.97). The average inter-item correlation is 0.63. The corrected item-scale correlations range from 0.71 - 0.86. Finally, the HSS also shows moderate test-retest reliability with average Pearson correlation = 0.62 (ranging from 0.54 - 0.72).
The Community Sensory Scale (CSS) is a 19-item scale that shares the identical stems with the Home Sensory Scale. However, the CSS asks caregivers to evaluate the impact of their children’s sensory functions on children’s participations in the 19 listed community activities. The response options range from 1 (none) to 5 (too much to participate). All the items in CSS have reasonable distributions. The item distributions are very different between families with and without children with ASD. While families with ASD children often have even distributions across response categories, families without ASD children mostly cluster around the lowest response category throughout the items. The CSS also displays a simple factor structure in which only one factor is required to explain all the 19 items. The CSS has very high reliability with Cronbach’s alpha = 0.98 (95% CI: 0.98-0.98). The average inter-item correlation is 0.73. The corrected item-scale correlations range from 0.82 - 0.91. Finally, the HSS also shows moderate test-retest reliability with average Pearson correlation = 0.76 (ranging from 0.55 - 0.85).
|
* Upon completion of the PES, you will receive an email with your scores. A de-identified version of your responses will be used as part of a larger research study to further develop and refine the measurement tool.
|
Please be advised that these are clinical research versions of the PSEQ, PSEQ-TV and PES that will be constantly updated and revised as we learn from them.
|
Clinicians, feel free to use this information in any way that you feel it will benefit your practice and your clients' understanding their child's responses to the Sensory Environment .
|
HOME PSEQ PSEQ - Teacher Version Parent Effort Scale Research Team Contact
© 2017 Beth Pfeiffer, all rights reserved

|
|
